CRIMP2 Tutorial
In this tutorial, we will explain how to:
Create Project
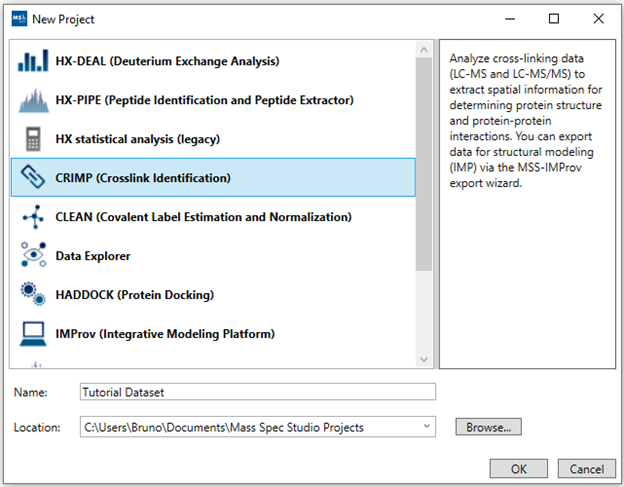
1. “New Project”: Create a new cross-linking identification search project by selecting “New Project” in the MS Studio main window and selecting “CRIMP”. The default location for new projects will be inside your Windows default “Documents” directory. You can select a different location by clicking “Browse” and selecting a new directory and name the project as you see fit.
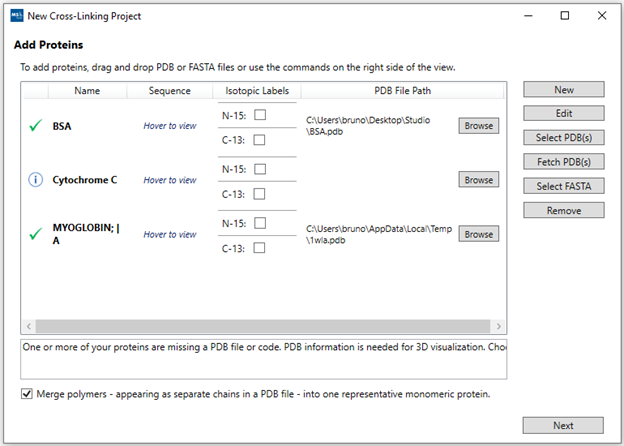
2. “Add Proteins”: If you have more than a single protein or
wish to use sequence visualizations, you can add your protein sequences either
manually (“New”), via a FASTA file (“Select FASTA”), via a PDB file (“Select
PDB(s)”), or via a 4-letter PDB code (“Fetch PDB(s)”, example: “1wla”) Each
protein will be listed in a separate row. If you have both PDB and FASTA for a
protein, after firstly adding the FASTA file you can use the “Browse” button to
link a PDB file to it. If adding both PDB and FASTA files separately instead of
linked, you may end up with duplicate proteins in the table.
The “Merge polymers” option can be used to remove duplicate sequences from homo
multimeric complexes which may appear as separate chains inside a PDB file
(example PDB-code: “1fu1”). It is also possible to include isotopic labels (15N
and/or 13C) to the proteins so heavy peptides are also generated and included in
the search database.
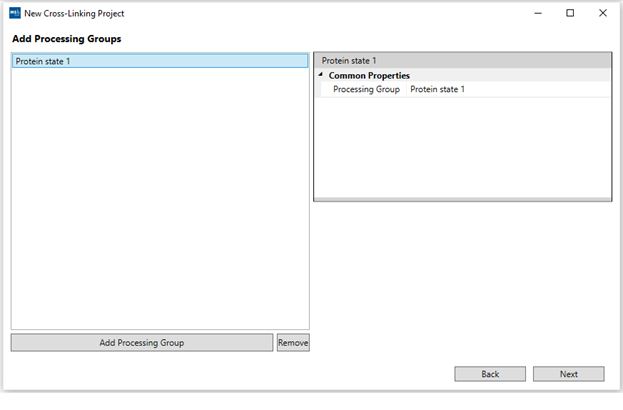
3. “Add Processing Groups”: For simple analysis, at least one processing group is required. They are used to separate searches/results for different experimental conditions using the same proteins added in the last step. You can rename every processing group using the right panel. Our demo only uses one condition.
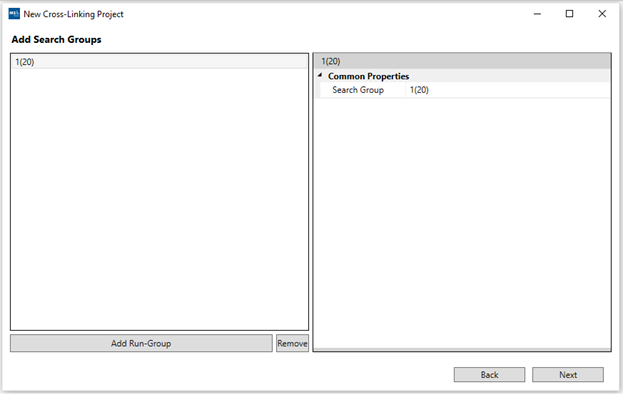
4. “Add Search Groups”: At least one search group is required. They are used to group different runs under each processing group for visualization and organization purposes. They do not affect the search or export process. You can rename the search groups as well before adding them by using the right panel.
5. “Select Crosslinker”: Choose the cross-linker used in the experiment. We have included an initial list with the most common molecules found in the literature.
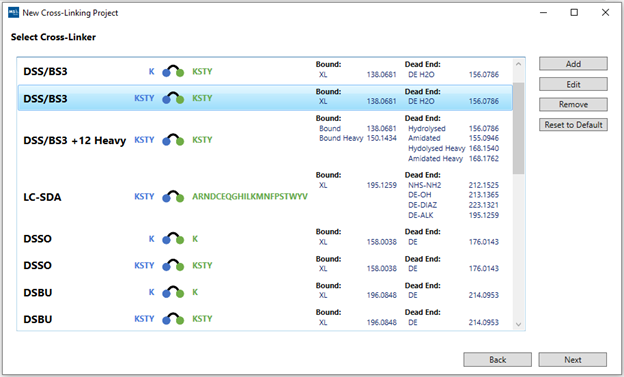
You also have the option to “Add” new molecules or “Edit” one of the entries on the list. By selecting either option, a pop-up window will appear where it is possible to edit the cross-linker properties. It is possible to give it a custom name, specify which protein residues it binds to and add the chemical composition of both “bound” (cross-linked species) and “dead end” (mono-linked species). Multiple modifications can be added for a single cross-linker and all of them will be searched simultaneously, but this will impact processing time.
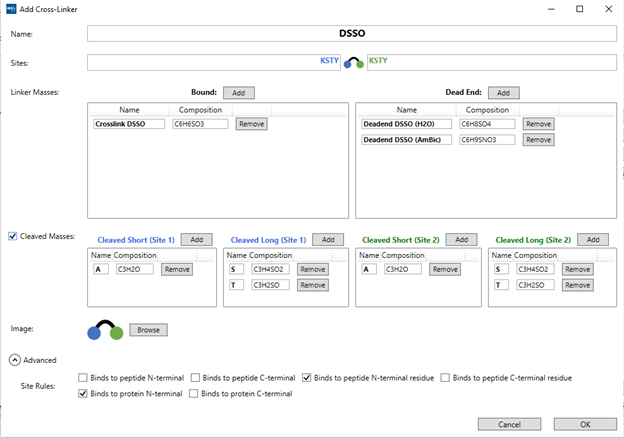
Mass Spec Studio also supports cleavable cross-linkers for either Stepped-HCD
MS2 or MS3 experiments. By ticking the “Cleaved masses” box, you can introduce
the composition for short and long chains on both cross-linking sites.
After selecting the correct cross-linker, click Next. For the demo dataset,
select the DSS/BS3 cross-linker.
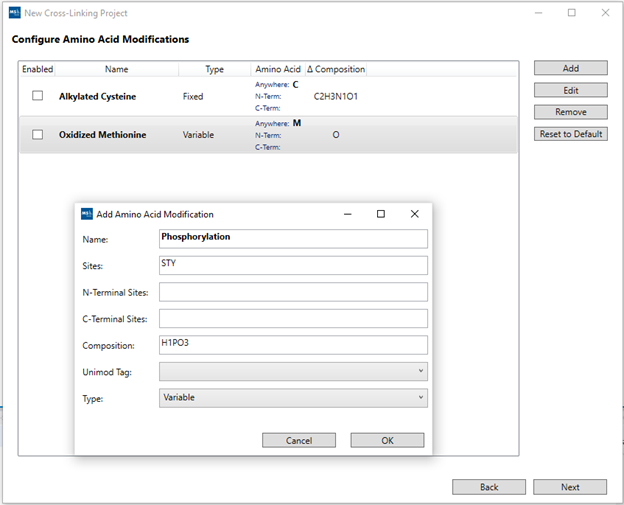
6. “Configure Amino Acid Modifications”: Check boxes for any
post-translational modifications present in the sample from the pre-loaded list.
It is also possible to add custom PTMs using the “Add” button. A pop-up window
will open where you can specify the PTM name, on which residues it can be found,
its composition and if it is a fixed or variable modification, which will change
how MS Studio generates the database for the search. After selecting the
pertinent modifications, click “Next”.
For the demo dataset, check boxes “Alkylated Cysteine” and “Oxidized
Methionine”.
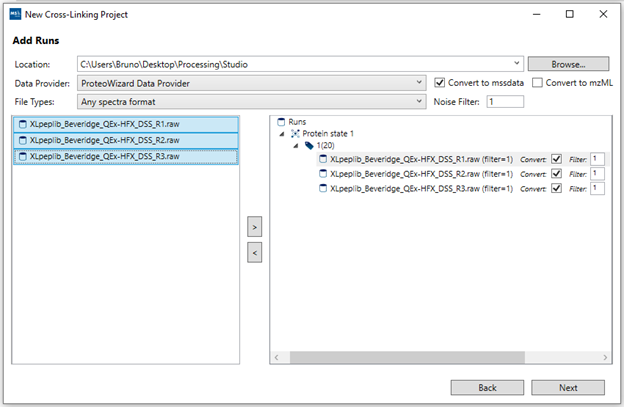
7. “Add Runs”: Follow these steps to add your data:
- a. Click “Browse” and select the root folder which contains your raw data files. In cases where the data files themselves are directories (example: Waters, Bruker), please make sure the containing folder is selected not the top-level .raw or .d directory itself. Note: Not all files have to be located under the same root folder from the start. After you add some files, you can still “Browse” to a different root directory and select additional files from the new location.
- b. For most raw vendor files, we recommend to use “ProteoWizard Data Provider”. If you have Mass Spec Studio converted files (.mssdata, .mssmeta), select “Mass Spec Studio Data Provider”.
- c. We recommend you enable the “Convert to mssdata” checkbox. When ON, raw vendor files will be converted to the .mssdata format which enables super-fast searching at the cost of some additional disk space for the .mssdata files. You can still proceed without converting the files, but the processing will be very slow. The “Noise filter” value is a multiplier of the minimum signal in each spectrum. A noise filter of “2” will remove any intensities smaller than 2 * mininum. A value of “0” will not remove any data.
- d. Select your replicates (shift+click or ctrl+click for multi-select), select the appropriate Protein State/Labeling node and click the “>” button. If you make mistakes, you can remove runs using the “<” button.
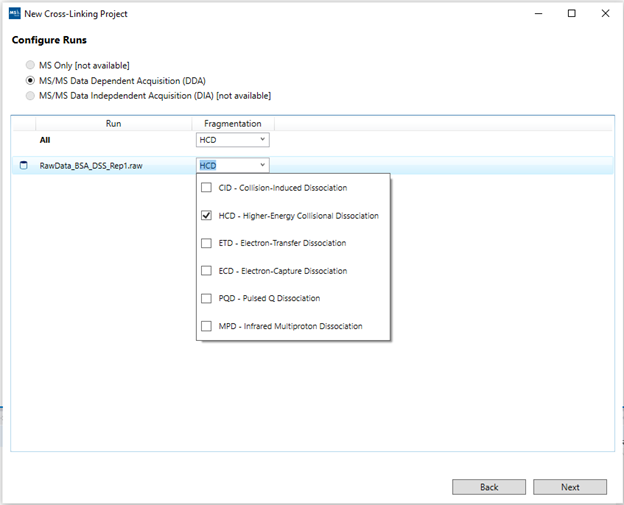
8. “Configure Runs”: Select the MS data acquisition regime for each run (or once for all runs). For the demo data, select DDA as the acquisition routine, and check HCD as dissociation method.
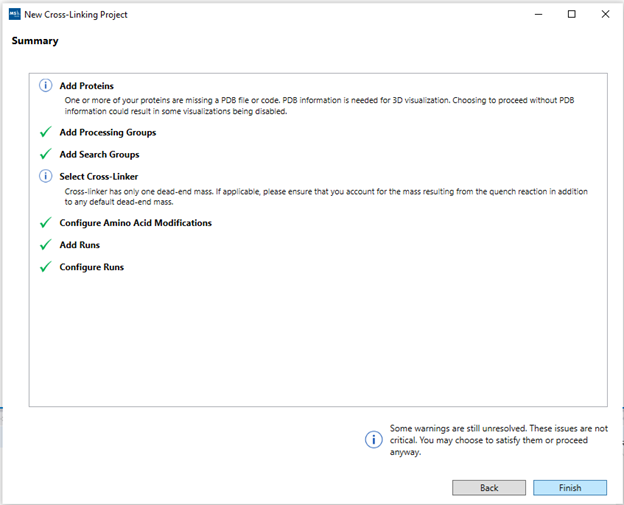
9. Summary”: The summary view will show a top-down view of the
project setup. Any missed errors or hints will appear under each step. Clicking
on a row in the summary table will navigate back to that section of the wizard.
Blue “info” buttons may be displayed with common alerts that might have been
overlooked (such as not including all possible dead-ends for the cross-linker,
or not adding PDB files to one or more protein sequences). These will not
disrupt the search process, so just review the info and if the messages are not
applicable to your project, just proceed and click “Finish”.
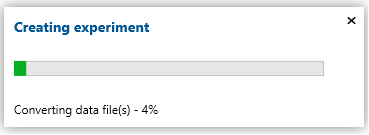
10. “Creating Experiment”: After clicking "Finish", Mass Spec Studio will convert the data files and set up the experiment. It can take a few minutes for large files.
Project Structure
After the project is created and the data is coverted, you will be presented with an empty screen with multiple panels.
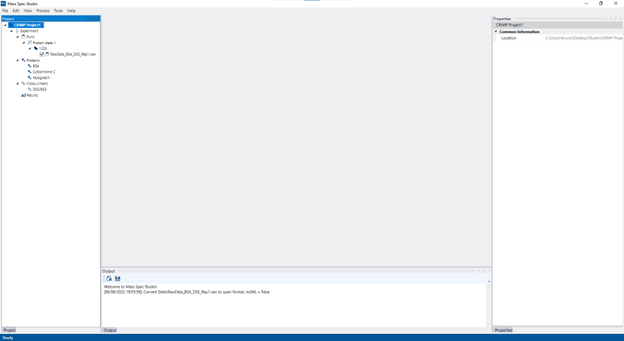
On the left panel, you will see the project structure containing all the info provided to the software. By expanding the different fields, you can see the proteins added, cross-linkers selected, mass spec runs, etc. If you need to change anything or add different runs to the project, right-click on the “Experiment” and edit the configuration. If everything looks good, you can start processing your data by going to the top menu and clicking on “Process”.
Hint: Panels and documents can be un-docked and moved to a different region or detached from the main window as a standalone window by clicking and dragging on the blue toolbar for panels and the title tab for documents. Clicking the pin icon will minimize a panel for a more compact view.
Hint: If any panels (left, right, bottom) are closed, they can be brought back from the “View” toolbar. To bring back the result views (middle - documents), you can double click on a result.
Processing
Once a project is created, you can open the processing window from the “Process” option on the main menu. The processing window has 3 areas:
- 1. The “Processing Routines” area will list the available routines that can be applied to your project. HX-DEAL has a single default “Peptide HX-MS” routine. Incompatible routines (for other project types) may appear in grey and can be hidden if the “Show Compatible Routines Only” checkbox is enabled.
- 2. The “Recent Parameters” area will save your most recent (last 5) parameter settings from previous successful runs.
- 3. The main right-side area will contain the list of adjustable parameters for the selected processing routine. Advanced users can choose to display additional “Advanced Parameters” from the checkbox on the top-right, which enable more control over the analysis. Parameters can be saved/loaded by interacting with the “Recent Parameters” list or to/from file (XML) via the “Open” and “Save” button on the bottom left.
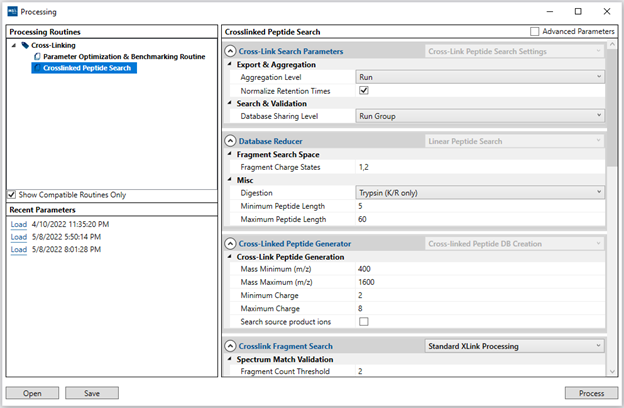
For most users, the standard parameters will provide good search results, but all available options can be customized if needed. For more advanced users who want to customize under-the-hood settings, you can enable these options by checking the “Advanced Parameters” box on the top right corner.
The standard search parameters for "Crosslinked Peptide Search":
- “Cross-link Search Parameters”: General parameters for the
cross-link search. If you wish to view all parameters including advanced
parameters, see the full Parameters page.
- “Aggregation Level”: The level at which data
aggregation should occur. The options follow the structure of your CRIMP
project on how you group biological and/or technical replicates:
- “Dataset”: All data from all runs across all groups and states will be aggregated together.
- “State Group”: Data from each state group will be aggregated separately.
- “State+Run Group”: Data from each state group and run group will be aggregated separately.
- “Run Group”: Data from each run group is aggregated separately, but the aggregation will works across different state groups.
- “Run”: Data from each run is aggregated individually.
- “Database Sharing Level”: Database sharing is meant to recover from stochastic differences between DDA runs by sharing linear peptide results across runs. The levels are the same as the point above (Aggregation Levels) where you can chose which runs or groups of runs should share information. For the best performance, it's best to allow propagation between technical replicates or the runs which are most similar. If you select the "Run" level, then there will be no database sharing and runs are searched in isolation.
- “Aggregation Level”: The level at which data
aggregation should occur. The options follow the structure of your CRIMP
project on how you group biological and/or technical replicates:
- “Fast-Tracked Export”: If you wish to go from processing directly to exporting results (skipping results validation), you can set paths and Q-value cutoffs for each desired aggregation target. This will generate .csv files at the end of the search. Note: The final results will still show up in the validation view, but you can access the .csv exports before it finishes writing and visualizing the results.
- “Database Reducer”: Settings for the initial linear peptide
search prior to crosslink pairing.
- “Fragment Charge States”: The charge states for free fragments to be searched for each linear peptide during reduction (before forming cross-links).
- “Digestion”: The enzyme used for digestion.
- “Minimum Peptide Length”: The minimum length in amino-acids of each linear peptide.
- “Maximum Peptide Length”: The maximum length in amino-acids of each linear peptide.
- “Crosslinked Peptide Generator”: The minimum/maximum m/z and charge for peptides (both crosslinks and monomers).
- “MS1 Mass Accuracy”: The mass tolerance for finding peaks for MS1 spectra. This will depend on instrument resolution and is one-sided.
- “MS2 Mass Accuracy”: The mass tolerance for finding peaks for MS2 spectra. This will depend on instrument resolution and is one-sided.
- “Peptide Elution Time”: The average length of time a peptide spends in the LC column (the average width of an XIC peak).
- “XIC Extraction”: The m/z window used in extract the XIC for a given peptide. This setting is similar to the “MS Mass Accuracy” where the PPM value is one-sided. This mass range will be applied around the best peak or the monoisotopic peak for XIC extraction, depending on the “Always use monoisotopic m/z (lock)”.
- “XIC Peak Picking”: The settings for finding peaks in the XIC data.
- “MS1 Peak Picking”: The settings for finding peaks in the aggregated MS data.
- “MS2 Peak Picking”: The settings for finding peaks in each MS2 spectrum. If you have data which is acquired in centroid mode, we recommend a really low value for the "Peak to Background Ratio" because the intrument already performed a first-pass peak selection from the underlying noise.
- “XIC Smoothing”: The type of smoothing for the XIC.
- “MS1 Smoothing”: The type of smoothing for the aggregated MS1 data.
- “MS2 Smoothing”: The type of smoothing for each MS2 spectrum.
Once your parameters are set, click "Process". A dialog window will appear:
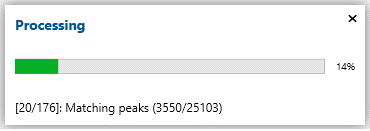
The processing routine will take anywhere between a few minutes to a few hours, depending on library size (# of proteins) and data density. When finished, a new result will appear in the “Results” section of your project tree. The processing routine can be re-run as many times as needed with different parameters combinations, with each result saved separately. Double-click on a result to open up the manual validation view as well as the rest of the visualizations in the middle document region.
Results and Data Validation
After processing is finished, the results will be nested in the left panel, so you have access to different versions in case you need to reprocess the data. You will be presented with the “Cross-link Validation” tab, which consists of several panels.
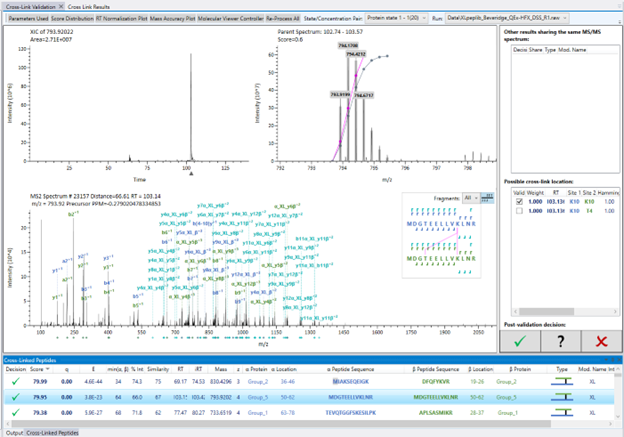
Right under this master tab, there are some statistical data available such as mass accuracy, score distributions including the FDR calculation from score distribution, an overview of the search parameters used, etc. The dropdown menu on the top right allows you to switch between the different runs. Only results for a single run are displayed ain the bottom panel at a time.

The bottom panel will list the candidate IDs found during the search, containing all related info such as score, m/z, retention time, peptide sequence (for α and β chains, when applicable), the type of modification (cross-links, loop-links, or mono-links), which modification was found and if the modified peptides are intra or interprotein. This list can be expanded in the second master tab “Cross-link Results” or scrolled through this bottom panel.
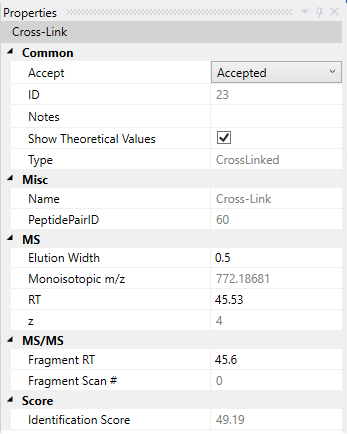
When you click on a given candidate, the panels will update to present the data from this selected ID. In the right panel, some properties about that candidate will be displayed, showing ID number, retention time for both precursor and fragments, charge state, etc.
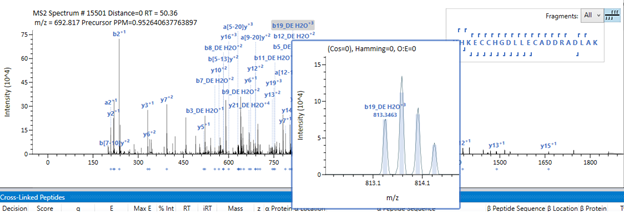
In the main panel, the extracted ion current (XIC) for the species - according to the processing parameters - will be displayed on the top left indicating the intensity distribution through the elution profile on your gradient. In the top right, the MS spectrum with the isotopic pattern will be displayed, accompanied by the theoretical peaks shaded in grey and the fitting function used to attribute the peaks to the candidate. In the main area, the MS/MS spectrum will be displayed containing all the peaks, and the pertinent fragments attributed to this ID will be labeled. On the right, the peptide sequences and fragmentation pattern (correspondent to the same color-code seen in the spectrum) will be seen, and the cross-linking sites will be connected in pink.
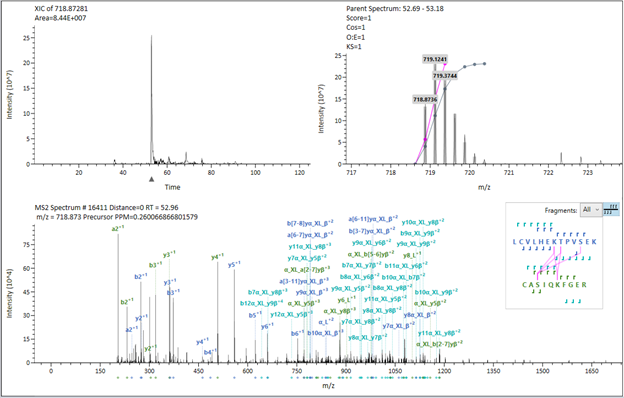
Upon hovering on the fragment labels, the raw fragment data will be magnified, and you will be able to evaluate the fit with greyed expected profile.
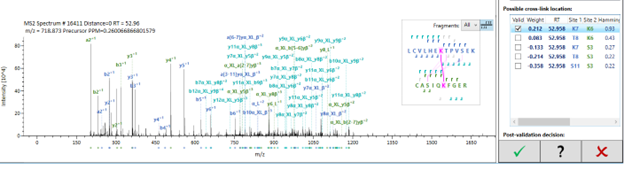
Two right panels will display different possibilities for the selected ID. The top one will display alternative candidates that could fit the same MS/MS spectrum and their respective score. By clicking on it, Studio will overlay this alternative ID on the current view, coloring its pertinent peaks in red while greying out previous peaks from the original candidate match.
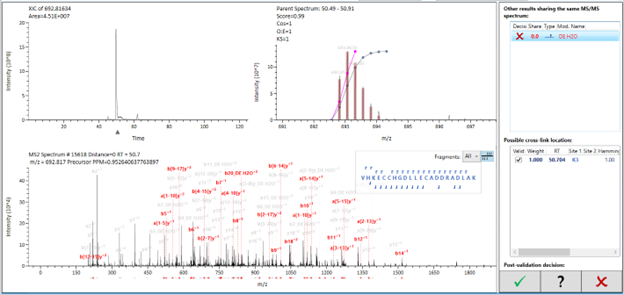
The bottom panel, on the other hand, will display all possible cross-linking sites within the identified peptides coupled with their respective scores according to the fragmentation pattern. Initially, all possible combinations will be displayed (in pink) but, upon selecting one of the site combinations, this selection will be enforced upon the others and all the fragments contributing for this identification will stand out while others will be greyed out.
Export
After evaluating the candidates and having a list of accepted IDs, you can export the results by going to “File > Export”. A pop-up window will open where you can choose from the checkboxes what type of results you want to export.
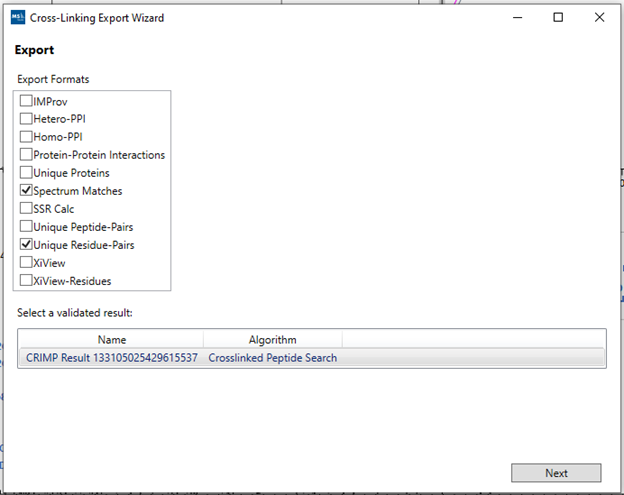
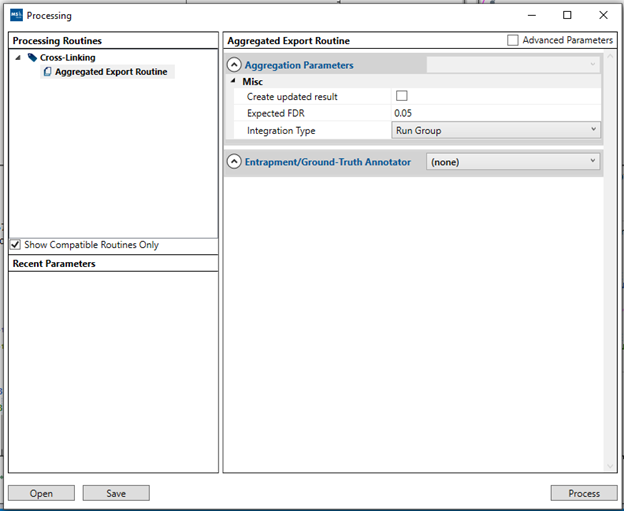
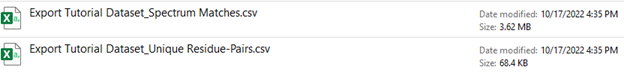
By selecting the desired boxes and clicking “Next”, you will be able to choose the directory where the results will be saved. Each selected box will generate an individual .csv file that can be opened in other applications such as Microsoft Excel. A new processing window will open to aggregate the results and generate the report, where you can adjust the FDR threshold used for the results export and at what level your results will be integrated. Once defined, just click “Process” to finalize the export and the files will be available inside the selected directory.
For more information or if you run into issues with Mass Spec Studio, please contact us.